The parliamentary committee
investigating Future Gaming Markets has received written submissions and has
held five days of hearings. Only a few
witnesses ventured into accounting and economic aspects of gaming and this
happened on the 7th and 8th February. The questioning by
the Committee was pretty low key. It seemed they were struggling with the issues,
not surprising given the enormity of the task in an area unfamiliar to all of
them. This note was written in response to the Committee’s offer to accept
comments from me that may assist in their deliberations following my brief
appearance on the 8th February.
The submissions and appearances
of interest (submissions and transcripts can can be found here ) were from:
· Australian Leisure and Hospitality
Group, the largest pokie operator in Australia associated with Woolworths
· Dixon Hotel Group, a local group with
35 hotels (not all pokie pubs)
· Tasmanian Hospitality Association
· Tourism Industry Council Tasmania
· Federal Hotels
One area where no progress was made was trying
to understand the costs associated with pokies at the venue level and at the
network level. Each face different costs some fixed and some variable. It is
crucial to understand the differences if pokies are allowed to survive outside
casinos,and a more equitable split is to be recommended between the network
operator, the venue, players and government. The note concludes with an Econ 101 presentation setting out costs and revenue for network and venue operator(s) before and after possible changes.
Australian Leisure and Hospitality Group
ALH paid almost half a
million in payroll taxes in 2015/16. This implies a taxable payroll of approx
$8 million. With 216 employees this implies average wages of just under $40k. This
is a useful metric to bear in mind.
ALH claimed to have paid
$6.9 million in gaming tax in the latest year. Strictly speaking they didn’t
pay anything because it was paid by Federal Hotels. They probably meant it was
paid by Federal Hotels in respect of gaming in their five establishments. The amount of Keno tax couldn’t possibly be
more than $100k as only $2 million was collected state-wide from 160 venues
including two casinos. That leaves, say, $6.8 million for EGM tax and CSL. That
implies player losses of over $22 million or $150k per EGM. This is most
unlikely. The average in Glenorchy is $79k per EGM.
ALH stated their five
venues were in the middle of the road on a turnover basis. This is untrue. Three
are in the top 12 and the remaining two well above average. Network Gaming
produces weekly rankings of all pubs and clubs should the committee want the
details.
ALH argued the financial
benefits from gaming need to be “fairly
and more broadly distributed” and referring to the owner operator model
said “the Government should reap the
benefit of the additional tax rather than have someone clip the ticket on the
way through.” That begs the question what is the quantum of the benefits
being referred to? How much is Federal Hotels clipping on the way through? And
precisely what exactly are the estimated network costs that an owner operator
would face? ALH are large operators. They would have some idea. Get answers to
those questions and it will be a large piece in the jigsaw puzzle. For the committee
to consider the owner operator model such answers are a prerequisite.
As a corollary it would
not be unreasonable to ask ALH for a $ figure or at least a % breakup of
receipts between accommodation bars bottleshop food gaming and other plus a $
figure for overall wages, totals across all five pubs. This info is readily
available by all operators and it would allow the committee to see the
contribution of each area to the overall entertainment mix.
ALH said “a key metric
for our group is a return on investment”. What is that rate of return? What
discount rate (ie implied rate of return) would ALH use to value a perpetual
license were it to be offered in Tasmania?
Dixon Hotel Group
It is important at the
outset to recognise that Dixons run a different model than say ALH. With 35
pubs, they only operate three. The rest are leased. Any comments need to be
seen in this context.
Taking over distressed
assets, recapitalising and enhancing them and then selling the leasehold
interest to a lessee operator and collecting a rental stream henceforth is the
basic modus operandi.
As an aside they probably don’t pay payroll
tax as that liability lies with each of the lessees whose payrolls are likely
to be below the $1.25 million threshold. ALH (see above) as owner/operators
admitted to payroll tax remittances of $500k and Federal Hotels probably pay
about $6 million annually.
Given the size of the
operation it would not be unreasonable to get on the record the number of Dixon
owned pubs with EGMs and the number of machines in each. For each of the other
multiple owners who are also operators, the info is provided by Tasmanian
Liquor and Gaming Commission.
There is a tendency for
the industry to thrust the plight of small owner operators into the spotlight
as a stalking horse for the larger multiple site owners.
There is much data in the
Dixon submission that will be useful to the committee. The EGM profitability case study in Annexure
2 reproduced below probably needs further explanation because there are no accompanying notes
So here goes:

So here goes:

· The pub has EGM turnover of $200k per
week leading to losses of $20k per week or $1.04 million per year.
· The machine rental is $90k which
suggests it’s probably a 20 EGM venue.
· The implied EGM losses are therefore $52k
per EGM per year which puts it about average across the state. It is
representative of Dixon pubs. It needs to be remembered however that average
losses for Glenorchy EGMs for instance are 60% higher. Top performers attract
even larger losses.
· Wages are listed at $75k. This is 7%
of overall player losses (equivalent to 22% of commission received by pubs which
are calculated at 30% of player losses). This is a significant piece in the
jigsaw. Just for the record, gaming wages are 7% of player losses. It
confirms the figures in my submission.
· Power is $25k which together with
wages of $75k gives variable costs at the venue of $100k or 10% of losses.
· Rates etc of $15k plus licence fee of
$5k together with machine rental of $90k gives total fixed costs of $110k or
$5.5k per EGM
· Rental/interest of $60k is mostly the
return to Dixons as landlord. To reflect the return to the venue, to the
landlord and tenant combined, to enable comparisons with owner operator
pub owners, the $60k needs to be added to the net profit of $43k to give a
venue net profit from 20 EGMs of $103k.
With fixed costs of $5.5k
per EGM plus variable costs of 10% of player losses it’s possible to establish
break even points and profitability of EGMs in pubs and clubs. This is set out
in the attachment at the end of this submission and backs up the numbers provided
in my submission.
What happens at the venue
level is reasonably clear. From an
overall viewpoint, with wages at 7% of losses, state-wide losses of $114
million for 2015/16 imply a wage component for EGMs in pubs and clubs of $8
million. Applying the average wage from ALH of $40k this implies gaming FTEs in
pub for EGM operations of 200. There may be many more licensed persons but FTE
numbers of gaming employees at any time may only be 200.
The next question then
becomes is the $103k venue return reasonable, bearing in mind it’s only an
average venue? Dixons made the point
with the case study in their submission that the net profit to the venue
operator of $43k was “exceptionally poor”
and “pathetic in terms of return to venue
when compared to other States.” (See page 4 of their submission). To repeat
the point already made, this is the amount left to the lessee after the rent in
respect of the gaming room is paid to the landlord. If the lessee isn’t
receiving enough then perhaps the landlord is grabbing too much? Maybe it’s not
only Federal Hotels getting too much of the pie, perhaps the landlord under the
leasing model as adopted by the Dixons is also getting too much? Is the lessee being
left in such a destitute position without adequate returns? Is government the
only saviour? This situation throws up many questions which are relevant.
· Dixons said (on page 39 of the 8th
Feb transcript) that “hotels leaseholds
sell on a 40% return which is two-and-a-half times the net profit”. Dixons
acquire hotels, fix them up and sell a leasehold interest to tenants. They
recoup some of their initial outlay and lock into a future stream of rental
returns.
· Net profit for a tenant will be after
payment of rent. How is this determined? My submission on page 21 talks about
the rental value of gaming being 25% of net commission income, as compared to
say bottleshops where rents are closer to 5% of bottleshop turnover. Gaming is far more profitable. The higher the
net revenue the higher the rental figure, which leads to a higher value of the
leasehold and a higher rental stream for the landlord. That’s how the lease
model works. Not unlike franchise arrangement that are much in the news
(Dominos, 7- Eleven etc).
· Leases usually run for a long term.
What arrangements are in place where lease terms extend beyond 2023? How will lease agreements deal with changes in
tax rates or total removal of EGMs from pubs and clubs if they occur after 2023?
· Are rents tied to movements in gaming
revenue?
· There’s a feedback loop at work here.
The greater the gaming profits the higher the value of the leasehold and the
higher the rents payable. Lessees may be getting a pathetic return but that
could be due to rents payable to landlords?
· In a leasehold situation tangible
gaming assets owned by tenants probably only amount to a few bar stools. The
EGMs are hired and the premises owned by the landlord who receives a rental
return. The tenant owns a lease, only part of which relates to gaming. It is
not immediately clear why a $43k return from 20 EGMs with average player losses
is pathetic? If the tenant expects a 40% return wouldn’t he be happy with a
$43k return if he had paid $100k for the lease. And that’s without returns from
other areas of hotel operations such as bars, bottles and food. Maybe the
leases had a higher sale value? Maybe if the returns from gaming comprise the
bulk of returns to the venue the business model is overloaded with risk and inherently
flawed? Maybe the tenant is being used as a stalking horse for the landlord?
Maybe the landlord is trying to lock in rental rates of return underwritten by
punters?
· Buying a leasehold business carries a
much higher risk, that’s why they sell on a 40% return. What is the return the
Dixons would expect if perpetual licences for EGMs were created at the venue
level assuming the landlord would acquire the license? 40%? A lesser figure?
What is the lower bound? How would an upfront price for a licence be reflected
in the value of a leasehold interest? And in the amount of rent charged? Even
if selling perpetual licenses was a good idea, the community will lose control?
Who will benefit most from higher leasehold values and higher rents? Will
communities with smaller leasehold operations be better off? And if 40% was the
discount rate used to value licences is it worth it from the government’s
viewpoint? The higher the expected return (or discount rate) the lower the
receipt to government via the up front tender price.
The leasehold model
crystallises the issues with perpetual licenses. To put it simply, perpetual
licenses are a way of capitalising the value of future player losses in the
same way as leases do. Certainty for the license and lease holders necessarily
means certainty of future losses for players.
As with ALH it would not
be unreasonable to ask Dixons for a $ figure or at least a % breakup of
receipts between accommodation bars bottleshop food gaming and other plus a $
figure for overall wages for its EGM pubs, not figures for each pub, but totals
across all venues. And similar figures for non EGM pubs. This would allow the
committee to see the contribution of each area to the overall entertainment mix
and the difference between EGM and non EGM pubs.
The constant thread running
through all industry submissions favouring a different network model are all
based on the view that Federal Hotels are making too much as the middle
man. What is an estimate of network
costs, say per EGM, that Dixons think is reasonable?
Tasmanian Hospitality Association THA
The general manager of
Shoreline gave evidence that his pub, which “sits comfortably in the top 10”
employs “17 you would say are directly involved in gaming...... which is about
13 full-time equivalents directly involved in the hotel on the gaming side”.
We know Glenorchy venues with 30 EGMs, not all of which are Top 10 have average
player losses of $2.4 million (my submission page 20). The Shoreline probably
has more losses than the Glenorchy average, let’s say, $2.7 million of losses.
This means its EGM commissions are $810k (30% of losses). Now if 13 FTEs are
employed in gaming then applying the wage per FTE of $40k (from ALH above),
gaming wages are $520k. Out of total gaming commissions of $810k? That is quite
ridiculous. And that is before machine hire of about $140k .
Hence when it is stated
that 13 FTEs are directly involved on the gaming side it doesn’t mean that
gaming is all they did. They must have had other duties, probably bar duties.
If we apply the Dixon wage percentage of 7% of player losses, gaming wages
would amount to $189k which is equivalent to just under five FTEs in gaming. The
impression given was that gaming employment was 2 1/2 times greater.
The industry misuse
statistics. Sometimes the number of licensed persons is given as if it reflects
the wage component of gaming. Other times the number of persons directly
employed is given hoping the reader will jump to the conclusion that being
directly employed in gaming means they don’t have other duties.
On the question of gaming
employment the THA put forward in its submission, and it was noted at the
hearing, that employment in EGM venues was twice that of non EGM venues. However,
correlation doesn’t imply causation. EGM pubs employed more than non EGM pubs before
EGMs were installed. They were selected for EGMs because they were better performing,
had more customers and hence more staff. It is not in the least bit surprising
that EGM venues maintain or even increase their relative position vis-a-vis non
EGM venues given the advantages bestowed on them via the implicit subsidy
inherent in the current EGM arrangements. Because they are bigger and employ
more they should be given further encouragement? Is that the argument? That
seems a perverse view of the role of public policy. The answer maybe is to
remove excess profits from EGM operations by adjusting machine parameters and
tax rates?
On the matter of
employment the committee was concerned about the employment effects in regional
areas if player losses are reduced. Firm answers were hard to find. The primary
effects are easy to ascertain. Direct gaming employment is 7% of player losses.
The Tasmanian Liquour and Gaming Commission publish losses per local government
area in its annual reports. Where the number of venues in a LGA are two or
fewer the losses are aggregated but it would a simple matter to obtain the
disaggregated figures from TLGC .
Two hotel operators
appeared as part of the THA delegation. It is not unreasonable to ask the %
breakup of sales between accommodation bars bottleshop food gaming and other
plus a $ figure for overall wages so the committee can understand the revenue
mix in what are two quite different operations. In the case of the Shoreline
the evidence was that $4.5 million was spent on capex in 2001. How much was
spent on the gaming room? And what returns have been generated as a result?
Operators are asking the government to assist them. At some point there must be
an obligation to reveal their current returns. It would be mandatory if asking
a bank for a loan or asking the Department of State Growth for a grant for
instance? What’s the difference?
Again we have the
contention that Federal Hotels are making too much as the middle man. The
industry must therefore have a view as to what the network costs would be under
a different network model. What is THA’s estimate for network costs, say per
EGM?
A confusing potpourri of
figures presented by all participants inevitably makes it difficult to see the
wood from the trees. On the matter of EGMs in pubs we know player losses were
$114 million in 2016. That’s a big loss
to punters but pubs and clubs other than those owned by Federal Hotels only
earned about $26.3 million in commission. After machine hire and wages only $11.8
million remained. (These figures are from page 23 of my submission). Less a few
other variable costs such as electricity and cleaning and the 86 pubs and clubs
probably only made a total of $10 million of gross profit. How does this
compare with total gross profits in the hospitality industry? It will be a
small fraction. THA will or should know. The industry tales of widespread woe
may be over hyped. Anyone with losses
greater than EGM averages can easily take a haircut. The possibility of say
reducing the house percentage from 10% to 5% might be one way of easing the
burden of player losses combined with stepped tax rates.
Tourism Industry Council Tasmania TICT
TICT’s submission stated
“there is no current market research on
the association between gaming activity and visitation to Tasmania.....there is
no evidence to suggest the presence of these facilities in Tasmania has any
influence on our appeal as a visitor destination.”
One quarter of EGM pubs have tourism
accreditation and they are important contributors to regional economies. But
that leaves three quarters of pubs with EGMs which are more focussed on the
local trade? Should they benefit via the freeloader effect from a measure that
may be designed to assist regional communities?
That begs the question, what are the
determinants of sound public policy for gaming from an economic and financial
viewpoint? For instance
· Is it a revenue raiser, bearing in mind gambling
taxes are regressive taxes and aren’t as crucial to State coffers as popularly
believed?
· Is it to ensure players aren’t exploited and
operators only make normal rates of return by adjusting machine parameters licence
conditions and tax rates?
· Is it to structure tax rates to assist lower
turnover venues such as clubs and regional pubs? Will the freeloader effect
mean others will benefit more?
Federal
Hotels
One of the main arguments that underpin the
rationale for another favourable deal is the contribution Federal Hotels makes
to the Tasmanian economy of $343 million in 2016. This is based on a Deloitte
report which is included in the written submission. The report deliberately
overstated the contribution of gaming ($274 million) by including all income
from the two casinos including accommodations receipts from 450 rooms, bars,
food, seminars and conferences. The breakup of receipts would have been readily
available and would have provided a better view of the contribution of the
various segments and would have provided the committee with a clearer view of
Federal Hotels’ operations.
In any event conclusions drawn from what
economists call input-output studies are of dubious worth. For a publicly available recital of the shortcomings of this approach,
see Gretton, P. (2013), On input-output tables: uses and abuses, Staff
Research Note, Productivity Commission, Canberra. (http://www.pc.gov.au/research/supporting/input-output-tables/input-output-tables.pdf
The following is an
extract:
“Abuse primarily relates to overstating the economic
importance of specific sectoral or regional activities. It is likely that if
all such analyses were to be aggregated, they would sum to much more than the total
for the Australian economy. Claims that jobs ‘gained’ directly from the cause
being promoted will lead to cascading gains in the wider economy often fail to
give any consideration to the restrictive nature of the assumptions required
for input-output multiplier exercises to be valid. In particular, these
applications fail to consider the opportunity cost of both spending measures
and alternate uses of resources, and may misinform policy-makers.”
If not spent on gaming, money will be spent
elsewhere with consequent different employment effects. There is no evidence
that gaming produces the best outcome even ignoring social harms.
Another of the restrictive assumptions of
input-output models is that interstate leakage doesn’t occur. Dividends for example
may fall into this category?
What is interesting about the Macq 1
development is, of the $45 million project, Federal Hotels’ share is only $10
million for the costs of the fit out. The balance of $35 million is presumably
funded by the owner of the building believed, according to media reports, to be
Vos Constructions. The same arrangement
applies at the nearby Henry Jones Art Hotel?
· Why has Federal Hotels chosen a policy of
large dividend payments rather than retaining earnings, reducing debt and developing
and owning properties instead of leasing?
· Wouldn’t this have made Federal Hotels less
reliant on securing a favourable gaming arrangement post 2023? Maybe even allowing greater returns to
players? Or to the government?
· In broad terms where have the shareholders
spent the $200 million of dividends received since 2003?
· Do any of Federal Hotels’ associates have any
interest, either freehold or leasehold in any other tourism assets or in
entities that have such an interest?
· Why did Federal Hotels abandon its regional
tourism strategy by selling Freycinet, Cradle Mountain and Strahan properties? Who
bought the assets? RACT bought the business assets but who bought the real
estate? Do any associates of Federal Hotels have an interest?
· Why shouldn’t the sale of the regional
properties be seen as reneging on a condition of the 2003 license deal? (The
2003 parliamentary inquiry clearly confirmed Federal Hotel’s placed the
regional strategy on the table as a quid pro quo during the 2003 license
extension negotiations with the government).
· Given everyday commercial risks it seems
unlikely that Vos Constructions as a builder would also be the owner of Macq 01
(and Henry Jones), so who is the owner? The reality is landlords have a much
larger interest in leased tourism assets than tenants. Given that Federal Hotels is seeking
government assistance it’s not unreasonable to ask who its partners are. And
what about the proposed Port Arthur project? Are there others involved? We have seen the same pattern with the
regional tourism properties sold by Federal Hotels. RACT bought the businesses
but not the real estate? Who did? Perhaps not a specific question for this
inquiry but it would add to a better understanding of the evolving structure of
the tourism industry.
Given Federal Hotels’ ability to attract
strategic partners as well as having a strong balance sheet weakened only by a
relentless pattern of dividends, it is not clear why gaming should be
structured to allow it to earn excess profits.
Its competitors don’t receive assistance.
There’s a need to ascertain the level of profits
in Network Gaming. Every industry participant has indicated a desire for a
larger share of EGM losses. But what exactly are the costs of networking? The
fixed costs? Any variable costs?
Whatever system is recommended for pubs and clubs, an understanding of network
costs is essential. Even if EGMs are confined to casinos the level of network
costs will affect the recommended tax rates.
If the committee is interested in the level of
excess profits in EGM pubs they should ask Federal Hotels how much the net
profits from gaming contributed to the purchase price for Mackey’s Royal Hotel,
Latrobe and Furner’s Hotel, Ulverstone, bought for a combined price of $33
million in 2010, and the acquisition of the Newstead Hotel in 2015 for $8.5
million
Attachment: Revenue and costs per EGM at venue and network
level
It’s important to
understand the costs facing both venues and the network provider(s) if any change
to the system, including changes to taxation, is contemplated.
Only EGMs in pubs and
clubs are considered. What follows is a graphical presentation of the numbers
in my submission.
At the venue level this
is the situation:

Revenue and costs are shown
on a per EGM basis.
· Revenue (red line) has a 30% slope
due to the fact that revenue at the pub level comprises 30% of player losses.
· Costs (blue line) has a 10% slope due
to variable costs of 10% (wages = 7% of losses plus electricity, cleaning etc).
Fixed costs of $10k per EGM is also included. These include machine hire, rates
etc plus a return on capital invested in facilities.(NB It does not include a rate of return on the cost of any licences
acquired by a new owner from an existing operator after 1997)
· The yellow shaded area shows a
deficit situation where costs exceed revenue.
· The green shaded area shows surpluses
where revenue exceeds costs.
· Because fixed costs include a return
on capital employed in the gaming area the surplus amount represents excess
profits.
Let’s look at the
situation facing the network provider.

The situation shown here
is before taxes and CSL.
· Revenue ( red line) has a 61% slope
indicating the share of player losses to the network provider (NB network share
of 61% + pub share of 30% plus GST share 9% = 100%).
· Fixed costs of $10k per EGM are
shown. This is an estimate which includes operating costs and a return on
capital. There doesn’t appear to be any variable costs. Network costs will be
the same regardless of EGM player losses.
· Deficits and surpluses are shown with
the yellow and green shaded areas.
· The surplus amount represents excess
profits.
Now let’s introduce tax
and CSL of 30%:

· The cost line (blue) now has a slope
of 30% equal to the rate of tax and CSL. Some of the surplus has been
eliminated.
The combined situation
for the venue and the network operator (a combination of Charts 1 & 3) is
shown here:
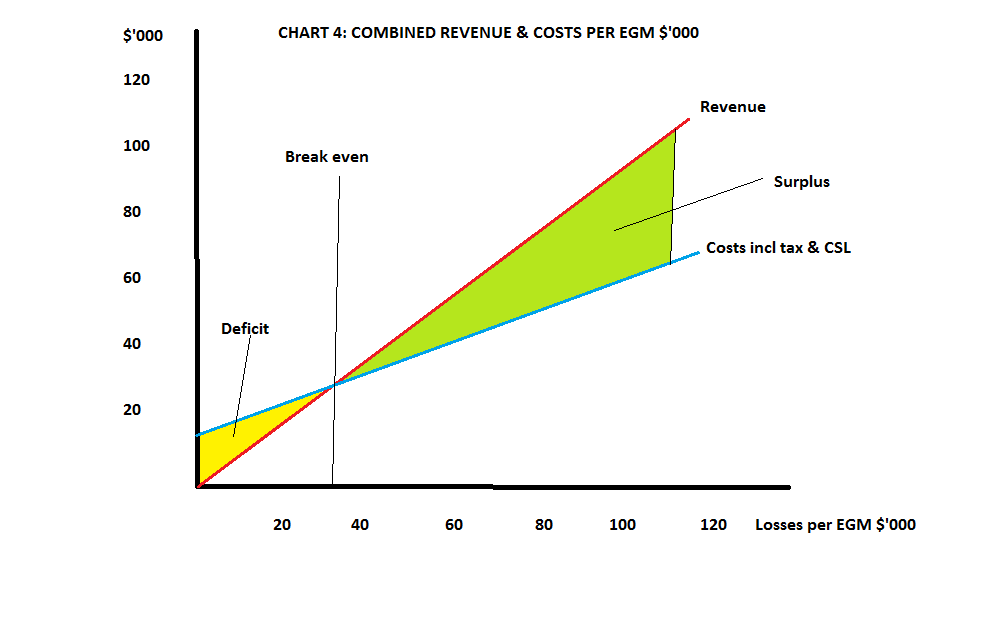
· The revenue (red) line has a slope of
91% (player losses less 9% GST).
· The cost (blue) line has a slope of
40% (tax & CSL of 30% plus variable costs at the venue level of 10%)
· Fixed costs are $20k per EGM.
· Every additional $1 of player losses
results in a surplus of 51 cents or 51 cents.
· As the fixed costs include a rate of
return on capital, break even is occurring below the average turnover per EGM
of $48k. Above the break even excess profits are generated.
If we apply a system of
stepped tax rates as proposed in my submission the combined situation will look
like this:

· The revenue line still has a 91%
slope
· The surplus amount is smaller.
· The cost line is now a dog leg with
greater slope and directional changes when losses per EGM losses reach $5k and $40k.This has the effect
of removing some of the surpluses.
· The aim of public policy arguably
should be to set the steps and the rates so that operators don’t earn usurious
rates of return. Even so, the area of surplus (green) indicates some excess
profits remain.
It must be stressed the
stepped tax proposal is predicated on the basis of removing excess profits
annually via taxes rather than via a lump sum up front tender process.
The final step, dividing
the surplus between the network operator (assuming there is one) and the venue,
is not included. My submission pencilled in a 50/50 split but this was without
a firm idea of network costs.
The previous chart
suggests small turnover venues (clubs for instance) will struggle to reach
break even. To date the discussion has assumed similar costs across venues
leading to one breakeven point common to all venues. But costs will vary
between venues, not only operating costs but fixed costs including a return on
capital. Small pubs and clubs probably have lower fixed costs, with lower
returns on investment required with less extravagant gaming room fit-outs.
If it were considered desirable public policy
to assist smaller venues the tax threshold could be set at the break even
point. Tax would remove excess profits
above the breakeven point thus allowing normal rates of return. The following
chart sets out the scenario:

With knowledge of costs
it is not difficult to structure tax steps to achieve any public policy
outcome.
If there are to be one or more network
operators selected via a tender, it could be specified that, say, maximum network
prices are set every five years by OTTER (Office of the Tasmanian Economic
Regulator). In other words the
government sets the machine parameters and tax rates and OTTER sets the network
fees. Normal profits would be the outcome for any operator who achieves break
even.
No comments:
Post a Comment